PROGRAMS INFOGRAPHIC / WfWI
infographics
CHALLENGE
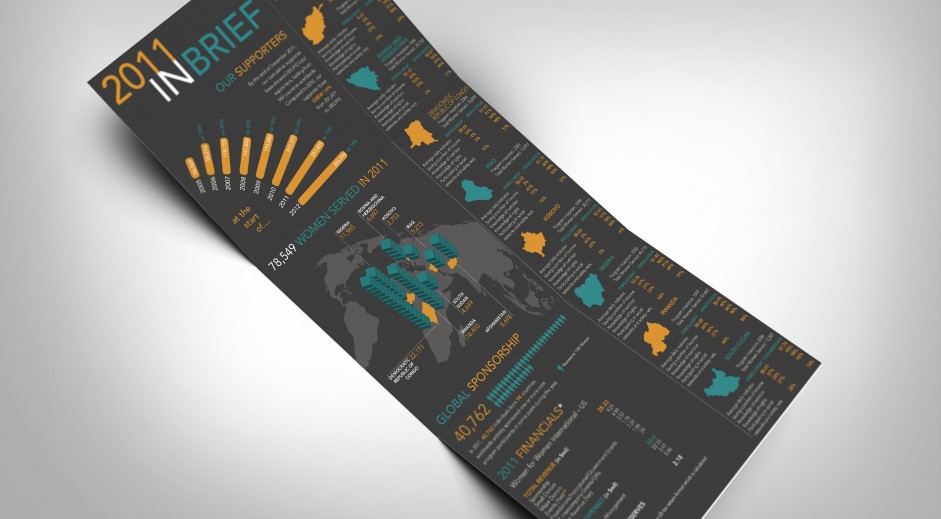
We were approached in late 2012 by Women for Women International to develop an infographic that captured all of the accomplishments of that year. The challenge was that there was so much data from many different programs in 8 countries.
SOLUTION
For this infographic, we decided to choose three colors that were part of the branding guidelines for Women for Women, with each color representing different data points. We also chose to highlight each country with a different color. Each data point was then brought to life with engaging graphic representations.
RESULT
The result was a year end development piece that Women for Women International used not just to remind they supporters of their accomplishments through this unique snapshot, but they could also use it to attract new supporters.